Not sure what to do next. Will likely be some repetition, but…
Age
Going to take another look at Age. Start with a histplot (density plot) for Age, with hue for gender.
See the problem? It took me some time. And, because of the way I set axes limits for the subsequent KDE plot, it didn’t show the problem.
Well it would appear my attempt to impute missing ages generated negative ages for some of the passengers. That really is not a good thing. So, I went back to the post Titanic Dataset: Missing Data, Part 3 and reworked the imputation. Now seems to have no negative ages. Clearing the output on the related notebook and restarting shows the negative ages are now gone. Now back to this post.
Probability Density Functions (PDFs) are overlapping. So we aren’t going to see any big differences with respect to Age. But, once again we confirm that for passenger’s under the age of 20, it would seem the likelihood of survival was better than that of perishing. Similarly for those between 30 and 40. Nothing new, but confirmed.
Now, Seaborn KDE plots for comparison and coding experience.
And, again, there are blue regions above the red regions for passengers under 15 and between 30 & 40. We will re-affirm this using the age groups we created in a previous post.
And, the same picture. So, though age may not be the most informative feature, it probably should stay in our set of preferred model features.
For curiousity’s sake, lets have a look at Age by Pclass. I’ll use a boxplot for this one (practice, practice).
And, again, first class passengers tended to be older. Might be an indication of potential Age feature outliers. Something that may need to be considered/dealt with.
Like I said, lots of repetition possible.
Notice that the bottom half of 1st class and the top half of 2nd class is in that 30-40 range. Perhaps that’s why we saw better survival numbers for that age group. I.E. the passenger class they were in rather than their age.
Let’s see if we can sort that somehow.
| | Survived | Perished |
|---|
| AgeBin | Pclass | | |
|---|
| 0-15 | 1 | 5 | 1.00 |
|---|
| 2 | 19 | NaN |
|---|
| 3 | 25 | 36.00 |
|---|
| 16-29 | 1 | 41 | 14.00 |
|---|
| 2 | 32 | 45.00 |
|---|
| 3 | 78 | 242.00 |
|---|
| 30-40 | 1 | 46 | 12.00 |
|---|
| 2 | 23 | 31.00 |
|---|
| 3 | 13 | 50.00 |
|---|
| 41-59 | 1 | 39 | 41.00 |
|---|
| 2 | 12 | 18.00 |
|---|
| 3 | 2 | 33.00 |
|---|
| 60+ | 1 | 5 | 12.00 |
|---|
| 2 | 1 | 3.00 |
|---|
| 3 | 1 | 4.00 |
|---|
That NaN in the Perished column forced the values to decimal rather than integer. I am at the moment too lazy to sort that out.
But looks like passenger class may have been a stronger influence in that 30-40 age group than age alone.
Fare
Now’s let’s have another look at the Fare feature.
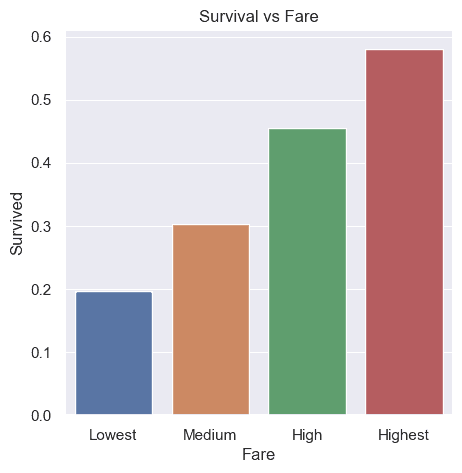
We have seen before that Fare appeared to have some correlation with survival. Here’s some code and a chart from an earlier post.
But we saw last post, that Pclass is strongly correlated with Fare. (Negatively correlated: I.E. 1st class fares generally higher that 3rd class fares.) Multicollinearity can cause problems with some machine learning algorithms. But, I don’t really know enough about that at this point. Something that might need looking into. That said, onwards and upwards.
Lower fares definitely reduce the likelihood of survival.
But big range. Let’s try using a log of the fare and see what we get.
Not sure about that drop in survival at the high end. But otherwise a somewhat linear increase in survival for the first 4 groups. Except that group 3 is only slightly more likely to survive than group 2.
When I reduced to just 4 groupings it was definitely a more linear increase without the drop at the end.
Let’s have a look at the log of iFare.
For the binned log of iFare, almost a linear trend except for bins 3 & 4 being pretty much equal.
All things considered, I will likely add feature with log of Fare or iFare or both to the dataset.
So, should I be using the logs for these fares rather than the fares themselves? Or should I be looking at using some form of normalization/scaling? Should I be binning the fares?
Just for fun, let’s use more bins.
Hardly more linear, and some pretty large confidence intervals for a number of bins. But, I think we should look at adding log fares (total or individual) or some form of normalized values for one or both fare types.
Okay, let’s take a closer look at that correlation between Pclass and Fare.
iFare, individual fare estimate, has less variance within and better separation between classes.
Let’s look the kernel density estimation (KDEplot) of survival by fare within each passenger class, for both Fare and iFare.
Fare does appear to have some predictive value within each class. Possibly providing more detail than Pclass alone.
A higher iFare doesn’t appear to improve the likelihood of survival. In fact for the two lower classes pretty much the opposite. Let’s look at fare by groupsize to see if anything pops out.
Fare generally increases with group size. Not so iFare. Which does make sense since iFare normalizes out the impact of group size.
And, in 3rd class, there is a downward trend in iFare for group sizes of up to 4. Likely/maybe due to fare discounts for families in that passenger class. Similar trend for group sizes of 3 and 4 in 2nd class. And, family/group sizes of 2 to 4 did seem to have a higher likelihood of survival.
Done?
This has turned into another lengthy post, so I think I am going to call it quits and take a break for an hour, or day, or two. Not sure if I am going to continue with this extended EDA, try a few new scoring runs or look at “science based” feature selection. Just so you know, leaning toward the last of those alternatives.
Feel free to download and play with my version of this post’s related notebook.
Resources